
General Methodological Approach
The Oiconomy Pricing system documents consists of:
- The Oiconomy Standard (O.S.), describing the system, included sustainability aspects, assessment criteria and measurement requirements. The O.S. contains the compliance criteria for certification purposes and guidance to the system.
- The Oiconomy Pricing Foundation Database (O.F. Database), containing all background data and assumptions.
- The Oiconomy Pricing Tool (O.P.T.), a questionnaire, guiding practitioners along all sustainable aspects and leading to the ESCU scores for the assessed product.
- This Science document, with explanation, scientific justification and references.
Oiconomy methodology
All aspects, including all product supply chain-relevant SDG’s, are divided in 10 categories, together comprehensively comprising all PPP sustainability aspects and all product supply chain-relevant U.N. sustainable development goals.
As sustainability indicator, a virtual monetary unit is introduced, the “Eco Social Cost Unit” (ESCU) representing the cost distance to a fully sustainable product and equal to the prevention cost based externalities embedded in the product.
All ESCU scores are the product of a quantitative factor and a price factor.
The O.S. and O.P.T. guide the practitioner through all aspects and all stages of activities related to the product, requiring to determine their foreground quantitative aspect and challenging the practitioner to also determine the foreground mitigation price factor and expected mitigation percentage.
Mitigation data need to be based on demonstrable investment proposals or cost calculations.
For both the quantitative and price factors, the system provides background data, which are automatically allocated from the included database when demonstrable foreground data are lacking.
Background quantitative data are obtained from a wide range of globally available databases and science. The Oiconomy Pricing System is designed to gradually improve the background data from anonymized results from the system itself and scientific research.
Background data are determined by means of the following 5-step procedure, derived from the EcoCost methodology (Delft University of Technology, 2022) ( https://www.ecocostsvalue.com) and described in (Croes & Vermeulen, 2015):
- Definition of the impact category or subcategory considered, together with the characterization factor, the indicator characterizing the relative weight within the category.
- Determination of the specific standard or target to be achieved.
- Assessment of available effective international standards and conventions, based on international standards or no-effect levels.
- Without such effective international standard or no-effect level, 80% reduction of the issue (relative to 1998 conditions) or, if concrete measurement of that reduction level is not feasible, at the benchmark made by the average level or methods or practices of the 20% best performers (usually countries).
- Where no such concrete target can be defined, the distance to perfect governance on the aspect, from which a Reducing Multiplication Factor (RMF) is calculated, which is applied to a worst case. The method for the determination of the RMF was developed for the aspect of corruption (Croes & Vermeulen, 2019) and is based on a range more than 60 criteria derived from generally recognized management certification standards such as ISO 22000, ISO 14040 and ISO 45001 (ISO, 2005, 2006, 2018).
Because in a series of real case test rounds in volunteering companies, this proved too difficult for small and some medium sized (SME’s), separate shorter, simpler and more aspect specific questionnaires were developed. The O.P.T. directs large companies and companies with experience with good management standards to the complete questionnaires and SME’s to the more simple questionnaires.
All questionnaires consist of 4 sections, divided in Plan – Do – Check – Act criteria. The scores of the 4 sections are multiplied, leading to a complete assessment (e.g. with a zero score on the management review (demonstrable top management commitment), the worst case remains assumed).
Background data provided by the O.F. are as much as possible based on global targets. For each individual actor, the foreground data must be based on the zero impact target (local and global).
- An inventory of the major available preventative measures.
- Determination of the costs and net effects of the available preventative measures and sorting these by the costs per one unit of the characterization factor, with the lowest on top.
- Assessment of which preventative measures are required to globally reach the target starting from the top of the cost-sorted measures. The last and most expensive preventative measure to be employed shows the marginal preventative costs. ESCU’s for issues with location dependent impact, the highest costs of major preventative measures, multiplied with a reducing impact dependent multiplication factor is allocated.
Marginal preventative costs for are depicted in figure 1.
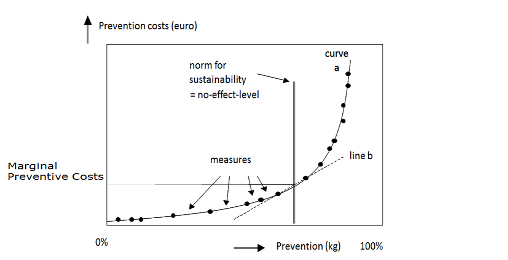
Figure 1. Marginal Preventative costs – EcoCost system (Vogtländer, Bijma and Brezet, 2002, p.60).
Curve a in figure 1 presents the costs of the available preventive measures from low to high costs. From an economic point of view, the cheapest measures for prevention of emissions are taken first and the most expensive last. At crossing point with the line for the no-effect level enough measures are employed to achieve the necessary impact mitigation indicating the “marginal preventative costs”. Although the developers of this system, only took Dutch and European marginal costs into account, the Oiconomy Pricing Tool considers these globally applicable, justified by the following arguments:
- Where the Ecosystem only works with background price factors, the O.P.T. gives practitioners the opportunity to demonstrably present their foreground price factors.
Companies especially are challenged to calculate their specific foreground data, e.g. by investment calculations, as the first step of actual implementation of the - Developing, low-income countries gradually evolve to high cost countries.
- Preliminarily, most of the considered supply chains are ending at high income countries’ consumers.